


If you ask someone how did they get their digital marketing reports done in such an organized way, the answer will be simple – Google Data Studio! It comes with a wide array of Google essentials and more powerful data sources.
Google Data Studio compiles a wide array of sources for data reporting and analysis. You will get Google Drive files, option to filter data, report pages, create charts, and do more edits from the dashboards.
Google Data Studio is free. As your client base continues to grow, you will need more sophistication on the reports. Introduced in 2016, Google Data Studio brings all your data sources into one reporting experience.
In this blog today, we are going to share the complete details on how to use the Google Data Studio. There are certain areas that you have to learn. These areas will make sure that your Google Data Studio is a successful one. These areas include:
- Using the right template
- Connecting the proper data sources
- Selecting the right metrics
- Sharing reports
How to use the templates of Google Data Studio?
This is the first thing to do while using GDS. You have to choose a template from the wide range of templates offered by Google Data Studio. If you are new, then it is important to choose the ones based on the type of data you will show.
You can customize fonts and create a consistent report with multiple pages. Since every client has different requirements, the presentation of reports should also be different. The best way is to create templates based on SEO, PPC, and paid social.
This will help you to customize them according to the client’s needs.
How to add the data sources?
Connecting the data sources is very important to create a great report. There is a myriad of connectors in GDS. When you use the connectors, it will take away the manual tasks and sync all data for you.
You can add the data sources at the beginning of the report of you can add them later on. You will find them in the “Add Data” toolbar. However, there are a lot of third-party connectors as well.
But the problem is, the third-party connectors come with additional cost, slows down a report and sometimes the metrics are deprecated.
How to choose the metrics that matter?
Metrics are important because your clients would not want to see a data dump. However, this doesn’t mean that you should use all of them. Use the ones that are needed.
For instance, if you want to improve your brand awareness, then you have to include pre-click metrics like clicks, impressions, view rate, CTR, and more.
using proper metrics and insights on goals, it will show the client that they are getting what they want. This is a win-win scenario!
Sharing the reports
When it is time for reporting and analysis, make sure to review the settings. You will get the following options:
- Inviting by email (the user should have a Google account linked with the email). You can assign the user to “view” or “edit” permissions.
- Anyone with the report link will be able to view the report.
Another cool feature is the option to limit sharing. This will do the following:
- Prevent editors from changing access and add new people
- Disable any download, view, or copy for the viewers.
How can you build and edit a report?
Let us guide you to build a report in Google Data Studio. The first thing to do is to choose the proper visuals.
Go to the toolbar and click on “insert”. You will have a wide array of options like Time series, Pie chart, Bar chart, Scorecards, Tables, and more.
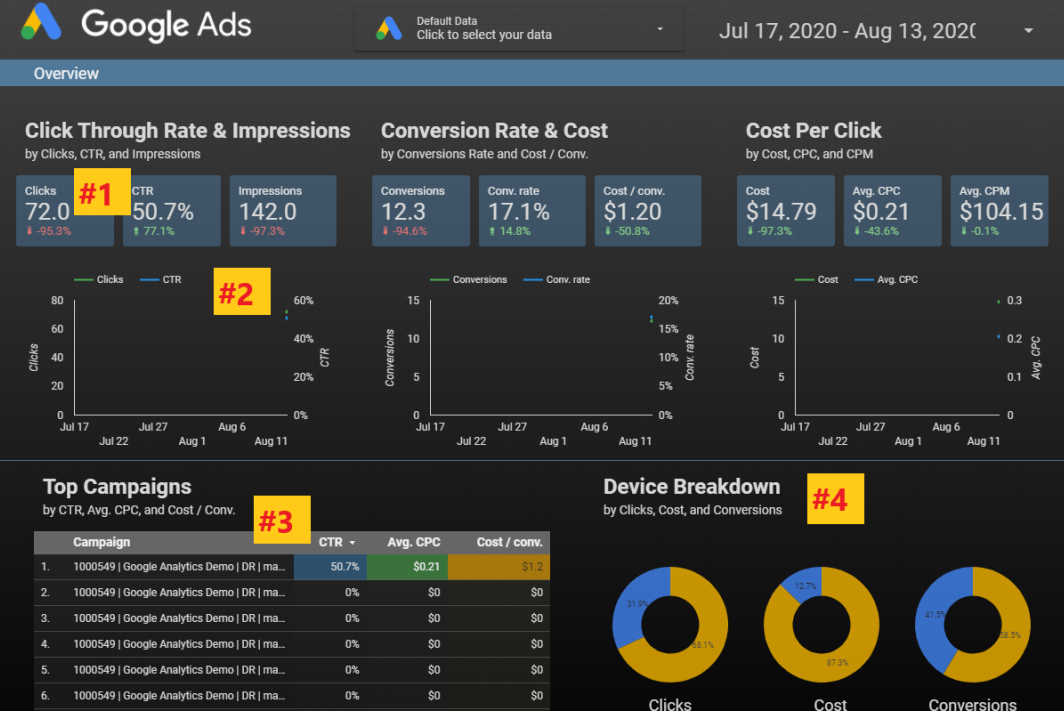
Let us consider four segments of a Google Ads template.

The first one is the Scorecard section. It shows a single metric taken from a data source. Depending on the source, you can choose multiple options like CTR, clicks, and impressions. It will also show the comparison changes.
The next is the time series. It will show you the change in clicks and CTR over a pre-set period of time.
The third segment is the table which allows you in drilling down the campaigns, ad groups, and customizes the metrics.
The fourth one is the Pie Chart. This is another tool to showcase comparisons between different data points like clicks, conversions, costs, and more.
All these features can help you in customizing the look of the report.
How to edit data formats?
This is how you change the look and feel of the report. For editing the format and style of visualization, you have to select a scorecard.
On your right, you will find the Google Data Studio editing panel. You can change fonts, background colors, change the comparison, and metric colors, text padding to align it left, right, or center.
If you want to select all the scorecards at once, select all of them at the same time. This is how you apply the style changes to all of the selected scorecards.
How to add report filters?
The best way to group multiple visualizations is by adding reports and page filters. For instance, if you want to change the tables and charts while editing the data range, all you have to do is all a data range icon.
Thus, even if the report is compromised, whenever the data range is updated, all the chart data is updated along with it.
If you want to get into the Device Type performance, there is also a filter for that. Go to “insert” then click on “filter control” and add the dimension of the “device” as a filter.
Even if you want to review the data by network type of Search or Display or YouTube, there is also a filter for that. Choose the Advertising Channel Type as the dimension while adding the filter.
Then there is the dashboard that gives you an overview of the website traffic, conversions trending, user behavior trending, device-specific conversions, and traffic, and more. You can check the PPC campaign performances, and search term reports.
In conclusion, it can be said Google Data Studio is currently the best way for creating reports and analytics. This introduction will help you in creating a customized and detailed report for your clients.


